|
Equity markets follow Business Cycles. Over past 9 years, Sensex has delivered only 4-5% CAGR. Business Cycle & Markets were at their peak during 2007-2008 period; which came to an abrupt halt due to Global Financial crisis of 2008. Market cycle just reversed thereafter & has not recovered so far in terms of Global growth or even India Growth story. Our IIP numbers are dismal, Corporate Earnings growth have not been robust, and inflation was at an all-time high till 2013-14. Couple of bad years of monsoon also did not help matters.
Though Equity markets are looking expensive in the context of PE Multiples (almost 21-23 on Sensex & NIFTY); one factor that can change or rerate the same is improving corporate earnings. When the denominator of PE Formula (Market Price/EPS) viz. EPS will improve, automatically market PE will get rerated & will come down due to improving Earnings Growth going forward. Currently, Public Sector capex & spending has started; which will be followed by the Capex & Expansion cycle by the Private Sector in coming years.
One data point which favors Indian growth story (besides Global liquidity, better monsoon, softening inflation, improving corporate results) is steady GDP growth of 7-7.50%. Add to that the inflation number of 5-6%; Nominal GDP growth number rises to 12.50-13%.
It took our country 60 years to become $ 1 trillion economy. It took us 7 years to double the same from $ 1 trillion to $ 2 trillion from 2006-07 to 2014-15; during which period Sensex went up from 15,000 to 30,000. With Nominal GDP growth of 12.5-13% going forward; our economy can double from current level in next 5.5 to 6 years. However, due to Global headwinds - maybe in 7-8 years i.e. Indian Economy can grow from $ 2 trillion to $ 4 trillion. Our Equity markets will also keep pace with this growth - maybe ahead or with a lag to this growth. Hence, markets can double from here over next 7-8 years period.
Volatility due to Global factors, US elections, State elections in India, huge liquidity driven asset bubbles, FED rate hike, etc. will be part & parcel of equity investing. If one has to embrace this volatility & make it their friend, one needs to invest in equities by marrying Fundamentals to Equity investing & that is possible only through some Process & Strategy driven Equity investing.
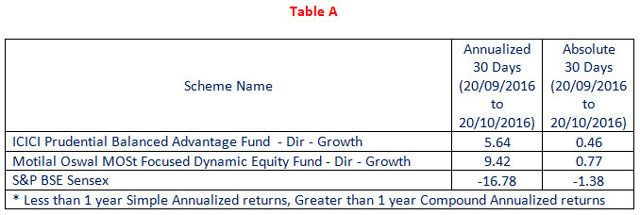
If one wishes to take advantage of this volatility & as India is sitting in a sweet spot to capitalize the same in its favor, some of the schemes & strategies to follow are as follows:
ICICI Prudential Balanced Advantage Fund Motilal Oswal Dynamic Equity Fund IDFC PE Systematic Transfer Plan (STP) strategy
All the above schemes/strategies marry fundamentals to Equity investing based on some formula & follow the principal of BUY LOW - SELL HIGH based on Market PE, PB, Dividend Yield or a combination of any of the same. These thrive & flourish during volatile periods like the current period.
Results of marrying fundamentals to Equity Investing in 3 zones viz. <16 PE, 16-19 PE & >19 PE of the Equity markets. If one would have invested in NIFTY or Sensex in different zones & held for 5 years thereafter (during period from 2001-2016); results would have been dramatically different as follows:
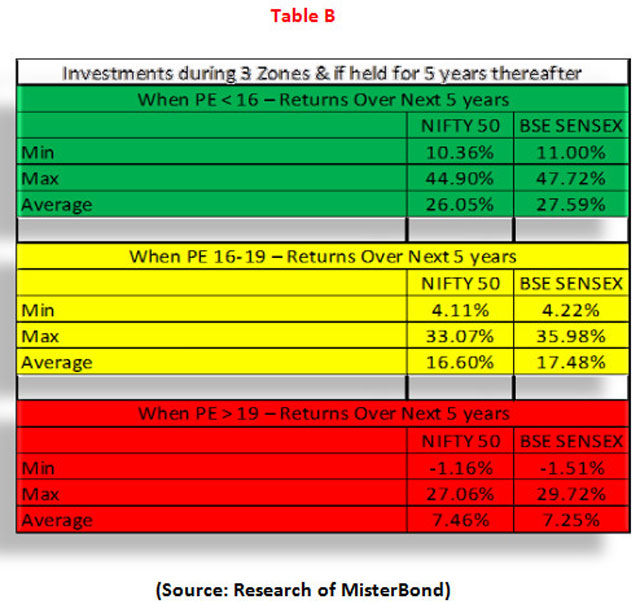
As can be seen from above, minimum returns in Green Zone is 10.36% which has come down to 4.11% in Yellow Zone & (1.16%) in the Red Zone. Similarly Average returns in NIFTY in Green Zone was 26.05% which came down to 16.60% & further down to 7.46% p.a. Unfortunately, following data of Equity inflows in different zones will be a shocker for the readers:

Above data gives more & more conviction on the following parameters:
Marry fundamentals to equity investing Have a constant strategy of Profit Booking SIPs & STPs are not continued during a) Bearish market periods as they generate negative returns b) during bullish market periods as SIPs tend to underperform one time investment during such periods & c) during stagnant market periods when SIPs underperform even FDs or Liquid Fund schemes (SIPs during 2010-2013 generated only 3-7% returns) Unfortunately, survey shows that only 2% investors stay invested for more than 10 years (hence, Investment returns are never investor returns) We need to reverse the investment patterns of investors i.e. they should invest during bearish periods (when most investors are in PANIC zone) & gradually reduce their investments during Bullish periods & have some profit booking strategies in place (during GREED zone) Introduce Asset Reallocation strategies while adopting profit booking strategies as this will help investors in a) profit booking, b) creating balance between debt & equity & c) continue to stay invested in equity as an asset class - at the same time marry fundamentals to equity investing as such schemes will BUY LOW & SELL HIGH based on market parameters

EXIT Strategy from SIPs - HOW & WHY
Our Industry has been only giving investment calls; either for lump sum or even for SIPs/STPs. Many phrases have been coined like "SIP KARO MAST RAHO", "SIP KARO BHOOL JAO", "FILL IT, SHUT IT, FORGET IT". At 7000 NIFTY we said invest for long term. At 8000 NIFTY we said invest for long term. Same call was repeated when NIFTY touched 9000. Definition of long term started getting stretched from 3 years to 5 years (even over 5 years NIFTY has delivered negative returns) to maybe 7 years going forward. This is not Equity investing; this is not marrying fundamentals to equity investing & this is definitely not Value Add from the Advisory community. If the funda is "SIP KARO MAST RAHO" without any profit booking strategy; then why would investors need us? Also, as mentioned earlier, there are many times when SIPs are discontinued. Please remember that DIRECT & DISCLOSUREs are real threats & investors have a choice if we don't add value to their investment process.
Also, please remember that when Advisors recommend only SIPs as a way of achieving different goals like Education, Marriage, Retirement, etc., the entire portfolios of the investors become Equity heavy. There is no balance between debt & equity & in such instances, volatility becomes our enemy rather than our friend in wealth creation process. Imagine a situation when an investor's goals were nearing in 2008-2009. Following table will highlight the importance of profit booking & creating balance between debt & equity:

Where the portfolio value had gone up to Rs.7.31 lacs on January 01'2008; the same came crashing down to Rs.3.61 lacs (lower than the investment value of Rs.3.70 lacs) as on January 01'2009; just because we told the investors "SIP KARO BHOOL JAO". Looking at this negative returns over 4 year period, I am sure investors in such a scenario would have discontinued their SIPs.
As against that, if we would have introduced an EXIT strategy from SIPs at the beginning of the investment process, things would have looked much different. What is this EXIT strategy & how does it work:
When markets deliver some abnormal, unsustainable returns or beat the benchmarks set by the investors at the start of the investment process (like say, 20% CAGR over 3-5 years on SIP portfolio); create a strategy of exiting from the SIP/Lump Sum/STP portfolios In January 2008, as can be seen from above, portfolio delivered 51% CAGR on SIP in NIFTY; market PE was at 28+ & market PB was at 6.5+ levels - extremely expensive zones Exit from these portfolios & get into Asset Re balancing strategies like ICICI Prudential BAF & Motilal Oswal MOSt Focused Dynamic Equity schemes Continue with your SIP/STP even after this profit booking; in the above example, even after booking profit & bringing the funds (Rs.7.31 lacs) into any of the schemes mentioned above (though these schemes were not in existence then) continue your monthly SIP in NIFTY (or any other scheme) from January 2008 to the current date say September 2016 At any time during this period, evaluate your SIP portfolio for these abnormal returns (maybe the current period) & repeat the same process as above
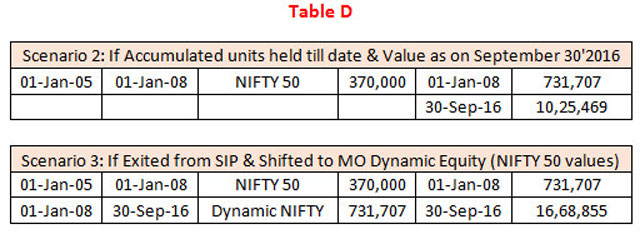
In Scenario 2, if the investor would have discontinued SIP post January 2008 but held the accumulated units till Sep 30'2016; CV of the same would have gone up from Rs.7.31 lacs to Rs.10.25 lacs.
As against that, if one would have exited from the SIP portfolio, booked profits & shifted to MO Dynamic Equity Fund (with NIFTY 50 base as Multicap 35 was not in existence at that time); CV of the same would have gone up to Rs.16.68 lacs - a huge jump over holding onto the accumulated SIP units for past 6 years.
Something similar will be observed for getting out of SIP portfolio from November 2007 to November 2010 (when markets after correcting to sub 9000 level Sensex in 2009 to a high of almost 21000 back in November 2010) & getting into ICICI Prudential Balanced Advantage Fund (which came into existence in April 2010):

Scenario 1 above depicts the scenario of doing SIP from November 2007 to November 2010 & stopping the SIP when markets started correcting thereafter. However, investor held onto accumulated units till September 2016 & their current values. These are different equity schemes of different AMCs.
Scenario 2 above depicts that the investor exited from SIPs in November 2010 & invested the same in I Pru BAF. CVs of BAF as of September 2016 are far higher that if the investors would have continued to hold as shown in Scenario 1 above.
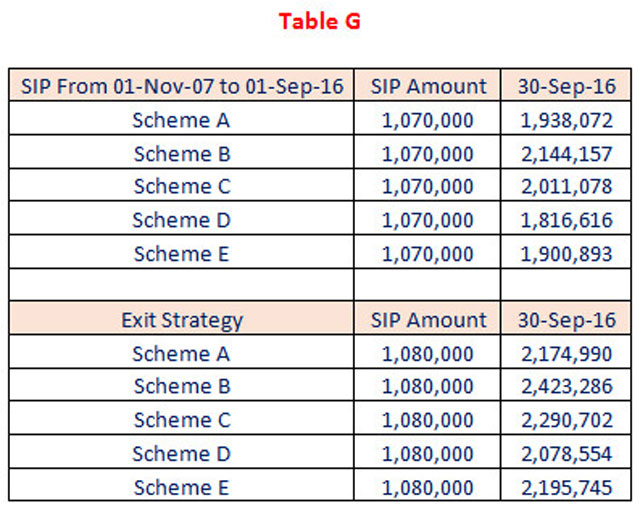
Following table depicts that even after exiting from SIP portfolios from Scheme A to E, investor continued the SIPs from November 2010 to September 2016 & their current values.
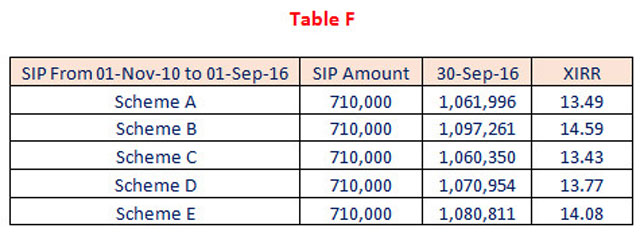
Following table depicts if an investor would have continued with SIP even beyond 2010 till 2016 i.e. from 2007 to 2016 & their current values. As against that if someone had adopted the Exit Strategy as explained above by exiting from SIPs, investing in BAF & at the same time continued with SIP from 2010 to 2016 & the Current Values under that scenario.
Clearly values under Exit Strategy at appropriate times & converting to rebalancing schemes like MO Dynamic Equity or I Pru BAF would have been much more beneficial.
What have we achieved through Exit Strategy?
Most importantly investor has converted notional profits into actual profits by exiting from SIP/STP portfolios at an appropriate time As soon the portfolio was converted into either I Pru BAF or MO Dynamic Equity, there was balance between debt & equity. In case of tables C & D above, in January 2008, MO Dynamic Equity in January 2008 would have had allocation between debt & equity in the ratio of 70:30 in favor of debt When markets correct thereafter, due to available cash in the portfolio, the scheme would have added into equity exposure & vice versa Even in September 2016, MO Dynamic Equity would be approx.. 50:50 in favour of debt to equity (inspite of having outperformed BUY & HOLD strategy) In case of Table G above, if an investor would have continued with the SIP from 2007 to 2016; entire portfolio would be extremely equity heavy & would be susceptible to equity markets volatility. In such a case instead making volatility a friend, it just may become an enemy for investors portfolio As against that, in the same Table G, wherein we had converted SIP portfolio to BAF in 2010; automatically there is a balance between debt & equity Inspite of that; Exit Strategy has outperformed SIP Karo Mast Raho portfolio Finally & most importantly, if we were to only advise SIP KARO MAST RAHO to our investors; then why would they need us going forward? They have a choice of going DIRECT DIRECT & DISCLOSURES are a real threat. In these times if we do not show our Value Adds like Exit Strategy from SIPs, investors will shy away from investing through us going forward

As regards IDFC PE STP
This strategy helps work around the emotions of the investors & their irrational behavior. As you have seen from above, only 1% inflows have happened into equities during Green Zone & almost 80% inflows have happened during the Red Zone. Green Zones were touched when markets corrected from 21000 to 8500 in 2008-2009 or when the markets corrected by 20% on one single day (on a base of 4000 Sensex) in May 2004 when NDA Government was toppled & Congress Government came to power.
As we all know, during these periods it was extremely difficult to convince investors to invest more when markets were correcting or collapsing. To work around this Greed & Panic of investors, IDFC PE STP is a Process driven way of investing 5X during Green Zone, 2X during Yellow Zone & 1X during the Red Zone. This will ensure that investors benefit by investing more when market PEs are less than 16 & less when market PEs are more than 19. Back tested data shows the following results of normal STP v/s PE STP over 5 year periods:

Now it is upto the Readers as to what strategy they wish to adopt & follow for their client portfolios. In current market PE of almost 21-24 (in the Red Zone), one can a) adopt Exit Strategy on some of the SIP portfolios of their investors & b) invest thru STP mode by adopting IDFC PE STP strategy to reduce equity investments in the Red Zone & increase the same when markets touch Yellow or the Green Zone for best wealth creation results in their client portfolios.
If you wish to view Exit Strategy from SIP or MO MOSt Focused Dynamic Equity Fund in video format & be part of knowledge enhancement & outsourcing, please join the Advisor 2 Advisor (A2A) Platform of MisterBond. Log into www.misterbond.in to know more about A2A program.
Share this article
|