|

I recently came across a very intriguing data on Indian Economy on some of my whatsapp groups. Though the data is very interestingly compiled, I am still unable fathom on how to read into it & put it in right perspective:
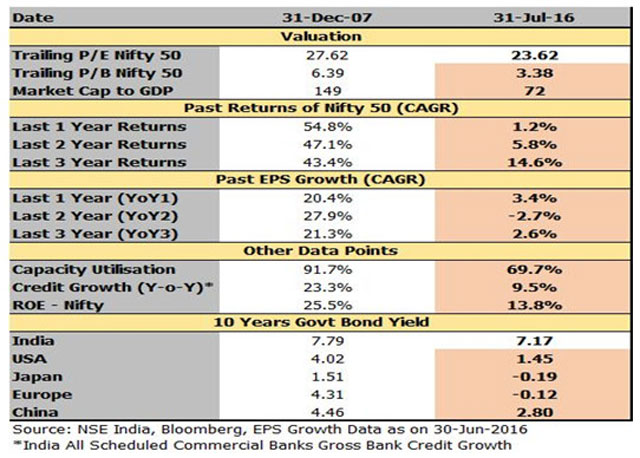
What does the above data mean? Undervalued Market in improving Macro economic factors or Overvalued Markets in poorly performing Macro Economic indicators? Most analysts have been saying that our Stock Market valuations are stretched currently. Some experts on the other hand are saying that India is the only beacon of hope in the Global gloomy scenarios & hence, our markets should be doing well going forward as well. What about the intermittent volatility? How does one manage client portfolios as well as emotions in such circumstances? Is it a liquidity bubble about to burst? Sounds so confusing, right?
Let's play this scenario to our advantage & for the benefit of our investors.
Best Asset Class is Volatility. How Do We Capitalize on it?
Only hurdle between capitalizing on volatility & making money for our investors is Investor Behavior & their emotions. They become greedy when markets are doing well (like the current scenario) & panic when markets start correcting (like 2015-2016 correction& 2008-2009 massive correction).
There are three ways of investing in Equity as an Asset class:
Systematic Investment Plans (SIPs) or Systematic Transfer Plans (STPs) Buy & Hold or as the tagline of Motilal Oswal says : Buy Right & Sit Tight Asset Reallocation strategies - reallocating between debt & equity based on market fundamentals
Let us consider each one & weigh the Pros & Cons.
SIPs or STPs
These strategies can work only if we are able to control Investor Behavior & Emotions. Let me elaborate. During bearish periods like 2008-2009 correction, many investors panicked & stopped their SIP investments due to Panic. During 2005-2008 period, many investors stopped their SIPs as markets were in a one way Bull Run & SIPs were underperforming one time investments - due to GREED of Investors. Or, SIPs were discontinued during the period 2010-2013 when they gave sub optimally returns of 2-5% p.a. due to sideways markets - when Investors became Impatient.
Statistics have shown that only 2% investors have stayed invested for more than 10 years. Hence, even though we keep on showcasing benefits of long term wealth creation thru SIP as strategy & make statements like SIP Karo Mast Raho, SIP Karo Bhul Jao or Fill it, Shut it, Forget it; Investment Returns have never been converted to Investor Returns due to the behavioral aspects & emotional aspects.
Those who are members of my Advisor 2 Advisor (A2A) platform on www.misterbond.in have seen my Video on Exit Strategy from SIPs & have agreed to what I had to say in this matter.
Buy Right Sit Tight
This is best left to experts like Motilal Oswal Fund House or other AMCs. You & I along with our investors are really not in a position to follow this strategy blindly & I will show you why:
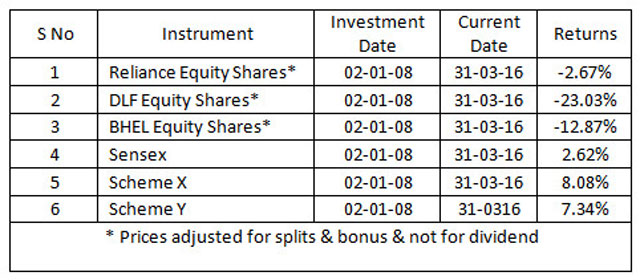
As can be seen from above, Buy Right - Sit Tight policy may not work every time for investors as well as for IFAs, if you have not BOUGHT RIGHT in the first place. If investors had bought individual stocks, they were in negative zone even after holding them for more than 8 years. If IFAs had recommended either Benchmarks or Equity MF schemes, performance is dismal 2% to 8% over a very long holding of 8 years. Would our investors be happy with such returns in Equity as an asset class over 8 year plus investment horizon? Probably not.
So, where have we gone wrong?
What are 5 Rules of successful investing in Equity Markets:
Do not invest on Tips & Hearsay Depend on Professional Advice Do not try to Outguess markets Ignore Media Noise &
What we are missing out as the most important rule for successful investing is:
Marry Fundamentals to Equity investing with Constant Profit booking strategy
Besides, the first four Rules which is hampering investor experience in equity investing, the most important Rule of Buy Low Sell High is not being adhered to by even the Advisory community. At 7,000 NIFTY, we gave investment call for long term, at 8,000 NIFTY, we repeated the same call & at 9,000 NIFTY also the same call for investing for long term. Where is correlation to Equity investing? Long term definition in these cases gets stretched from 3-5-7 years & maybe 10 years going forward.
So finally, the Best Approach to make VOLATILITY as our FRIEND for successful & happy investing experience is to adopt Asset Allocation (Reallocation) strategies. These strategies marry fundamentals to equity investing, Buys Low & Sells High & works around Investor Behavior & Emotions.
Typical Investor Investment zones are as follows. Unfortunately, though Market Valuations give us indications of over bought or under bought zones, we ignore them & do just the opposite:
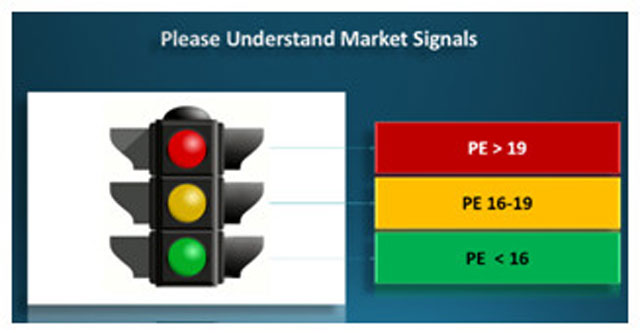
Above Green Band (PE < 16) gives a clue of undervalued markets where investors need to BUY rather than SELL. Unfortunately, these bands were witnessed during huge corrections like May 2004, 2008-2009; when most investors panicked & exited rather than investing Yellow Zone is a zone of reasonable valuations (PE between 16-19) Red Zone is a danger zone when investors need to have to show caution, exit or not enter (PE > 19). However, as seen in most instances, these are the zones when investors have invested maximum due to Euphoria, Over Confidence, Herd Mentality, etc.
Hence, the only way to marry fundamentals to equity investing with constant profit booking as well can be possible through Asset Reallocation strategies.
I discussed this at some length in my WF article in March this year, which was titled 4 effective equity investing strategies. I have been a keen proponent of this genre of products, and in my earlier article, I have showcased the results of three products that are prominent in this category: ICICI Prudential Balanced Advantage Fund, Franklin India Dynamic PE Ratio Fund and Principal Smart Equity Fund.
I now want to draw your attention to the newest addition in this category of funds - the Motilal Oswal Dynamic Equity Fund. I am very happy to see quality equity fund houses taking to this category - this category deserves to grow and as more and more high quality fund houses commit energy and resources to this category, its reach will increase, thus benefiting more investors.
Motilal Oswal Dynamic Equity Fund as a solution
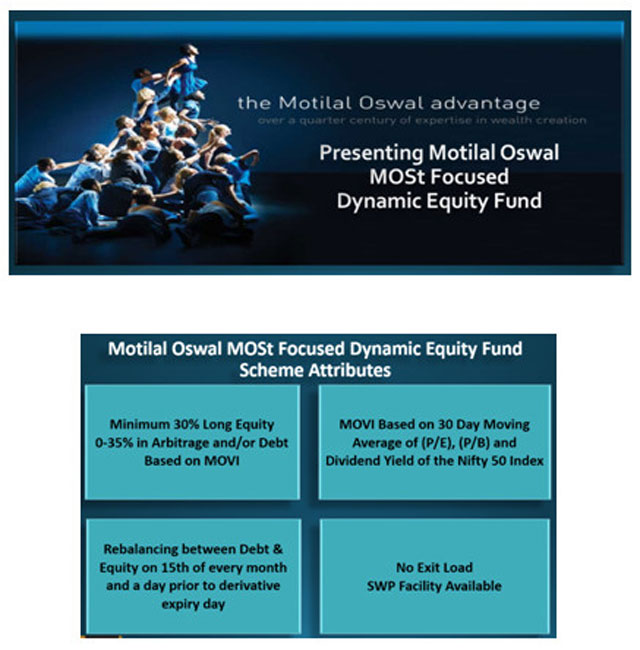
Motilal Oswal has now come with an Equity Scheme which incorporates all this & more. They have an in house model called MotilalOswal Value Index (MOVI) which has been specially designed for this scheme. MOVI is based on market PE, PB & Dividend Yield which readjusts itself based on 30 day Moving Average & does rebalancing between debt & equity twice in a month viz. 15th of every month & on the date prior to the F&O settlement date every month.
Let me share actual returns data under these various zones of NIFTY v/s NIFTY MOVI from 2001-2016:
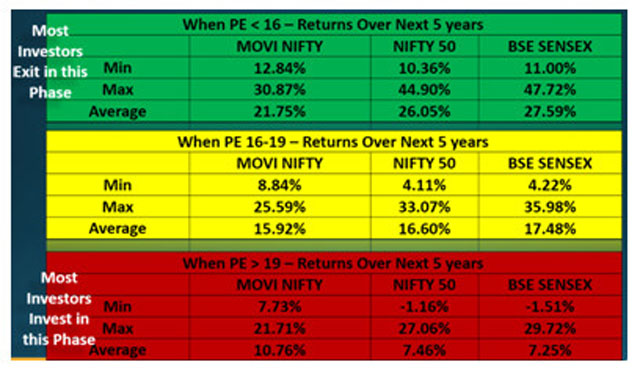
How do you read the above table?
Markets were divided under different PE bands as mentioned above. The above observations are daily rolling data of investments on these band dates & performance over next 5 years thereafter.
Green Zone shows that an Investor would have earned an average return of 21.75% through NIFTY MOVI v/s 26.05% in NIFTY & 27.59% in BSE Sensex. However, as discussed above, these were the bands when most market participants actually exited & not invested. Hence, actual investment returns never reflected in Investor returns. On minimum returns side, NIFTY MOVI has done far better than NIFTY or Sensex.
Now let's talk about the Red Zone. As can be seen here, minimum returns under NIFTY MOVI is almost 7.50% v/s negative returns observed both under NIFTY & Sensex. At the same time, average returns under NIFTY MOVI is as high as 10.76% v/s almost 7.50% in NIFTY & Sensex. As explained above, most investor experiences of investments in equity schemes is under this zone.
Now as Advisors, you need to understand & introspect as to which is the best strategy for you & your investors to have a successful & happy investing experience in Equity as an asset class. Following 3 & 5 years daily rolling returns of NIFTY v/s NIFTY MOVI will further strengthen my argument in favor of Asset Reallocation Strategies as the best form of Equity Investing:
Since, none of the Equity schemes of Motilal Oswal has long track record, actual back testing of MOVI has been done on NIFTY from 2007-2016. However, since the Dynamic Equity scheme is likely to mirror (not 100%) their MOSt Focused Multicap 35, by applying MOVI on the said scheme I have generated following 12/18/24 month daily rolling returns of the said scheme with MOVI:
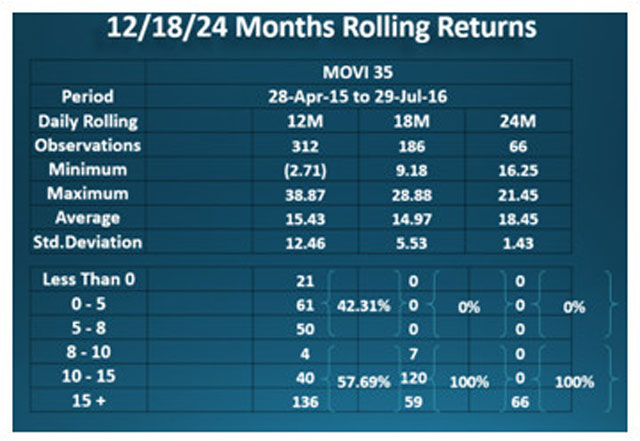
Above table shows that over 18 & 24 month daily rolling returns analysis (in spite of huge correction of almost 20% plus from March 2015 -2016); none of the observations are negative. Not only that, in 18 month period, 100% of the observations are in 8% plus returns zone & in case of 24 months, 100% observations (though limited in number totaling 66 observations) are in 15% + returns zone.
Now an analysis of daily rolling returns for 3 & 5 years from 2007-2016. Please note that this analysis is on NIFTY as a benchmark. In all cases, actual scheme performances have beaten the benchmark by 3-6%; which should be kept in mind while looking at below numbers:
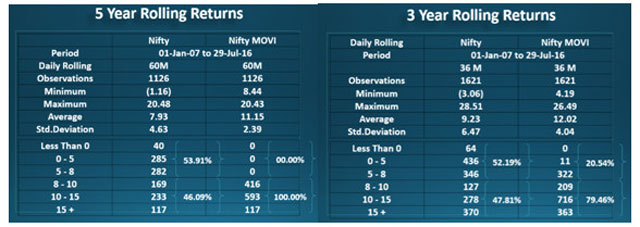
As is clear from the above tables, under 3 year rolling returns analysis, 80% of observations on returns are in 8% & above band & 100% of the observations are above 8% + band in 5 year daily rolling returns analysis & none of them in negative zone v/s quite a few observations of NIFTY returns under both analysis has negative returns as well with more than 50% in below 8% returns band.

So finally, how does one sell this scheme as a solution & not as a scheme or an NFO?
First & Foremost identify needs of your investors. Invariably, to fulfill those needs, investors are using traditional investment vehicles. Then identify how we can provide solutions to the same investor for the same needs through this Asset Reallocation scheme of Motilal Oswal & then pitch the right data points as mentioned above to convince these investors.
This is 5 Point Mantra of MisterBond to convert Mind Share into Wallet Share:
Need: Some emergency cash stashed away over a period of time Current Solution: Recurring Deposit earning approx.5% post tax returns
Alternate Solution: SIP in MO MOSt Focused Dynamic Equity Fund wherein you can show case 3 year rolling returns of SIP. Average returns of SIP will be far superior to RD returns
Need: Investment in Debt scheme with 3 year plus view Current Solution: FDs or Accrual Debt scheme with 3 year Plus holding
Alternate Solution: Lump sum investments in MO MOSt Focused Dynamic Equity Fund with 2-3 year plus investment horizon. As is showcased above, most 3 & 5 year rolling NIFTY MOVI returns are in the band of 8% & above. If one invests in such schemes like Dynamic Equity, one need not create a separate folio for debt schemes. Reason being that under such Reallocation schemes, average equity holdings is between 40-60% & hence balance is always held in debt like liquid schemes. Allocating funds for separate debt schemes will have its inherent risks of credit, interest rates, liquidity, etc.; besides being stuck for 3 year plus for taking benefit of Long Term Gains Tax. As against that, investment in this scheme will satisfy investors need to have allocation for debt with taxation of equity post first year of holding
Need: To Safeguard returns earned over a period through SIP & create balance between Debt & Equity (as only SIP portfolios are extremely Equity heavy) Current Solution: There is no solution for achieving this
Alternate Solution: Identify your client SIP portfolios which have generated huge returns over a period of time. At current market levels, prudence will be to exit from them (which will help in profit booking & not let profits remain mere paper profits), invest these funds in the said scheme (thereby insulating the portfolio from market vagaries & volatility as the said scheme will marry Fundamentals to Equity investing) & lastly, this strategy will automatically create balance between debt & equity. Current allocation based on MOVI in the said scheme is 55:45 in favor of equity. Besides this, when markets correct at any point in time, your SIP portfolio values will also erode accordingly. As against that, by converting to this scheme with 45% allocation to debt, on market corrections, this scheme will increase equity allocation based on MOVI number & bands
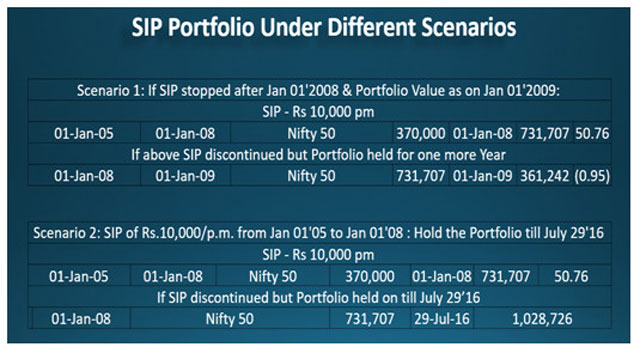
Scenario 1:
Above table shows if an investor had started aSIP of Rs.10,000/p.m. in NIFTY from January 01'2005 to January 01'2008. Value of Rs.3.70 lacs invested during this period has gone upto Rs.7.32 lacs. Further assumption is that the investor discontinued the SIP after markets started correcting but held onto the SIP position. Investor's portfolio value over next 1 year from January 01'2008 to January 01'2009 collapsed from Rs.7.32 lacs to Rs. 3.61 lacs & 90% chances are that he/she would have exited at this level with loss in portfolio.
Scenario 2:
In Scenario 2, I have assumed that after discontinuing the SIP post 2008 correction, investor did not panic but held onto the portfolio till July 29'2016. Value of the portfolio grew to Rs.10.28 lacs.
In both the above scenarios, in all likelihood the investors would have panicked, discontinued his/her SIP investments & redeemed out of sheer panic the entire portfolio at a huge loss even in SIP format.
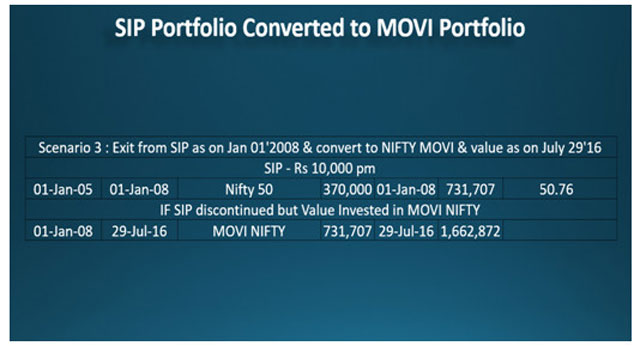
Scenario 3:
Here, the assumption is that the investor looking at overvalued markets, exited from the SIP Portfolio & invested entire proceeds in NIFTY MOVI i.e. Rs.7.32 lacs was redeemed & invested on January 01'2008 in NIFTY MOVI. Since January 01'2008 to July 29'2016, this portfolio has grown to Rs.16.63 lacs v/s Rs.10.28 lacs as shown in Scenario 2.
Hence, as mentioned, here the investor did profit booking when markets were overheated, safeguarded his paper profits, converted that to a strategy that Buys Low & Sells High through NIFTY MOVI, created a balance between Debt & Equity & finally came out on top over past 8 years with constant profit booking & taking into account funadamentals of the markets as well.
Need: Cash flow requirements by Senior Citizens -
Current Solution: Interest from 3-5-10 year FDs
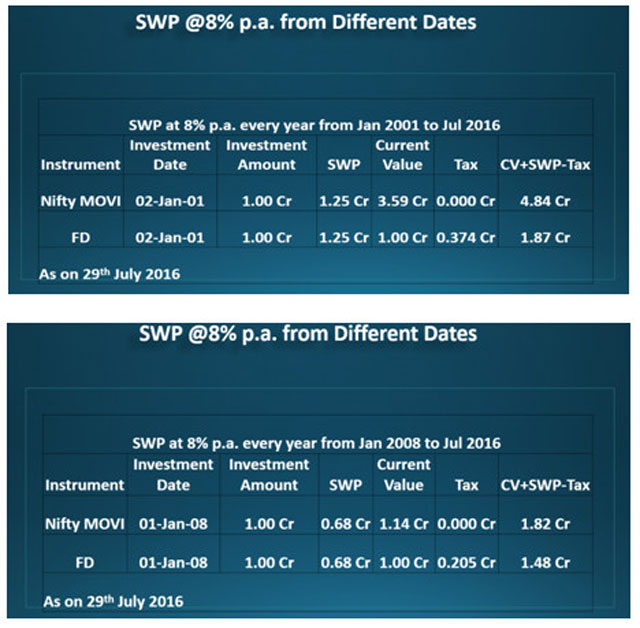
Alternate Solution: SWP from MO MOSt Focused Dynamic Equity scheme with 3-5 year plus investment horizon. This will not only fulfill cash flow requirements but also make the cash flows tax efficient through SWP Mode & at the same time beat inflation over longer periods of time by generating wealth even beyond the SWP. Following data will elaborate this further:
Share this article
|