|
WF: Your traffic signal tool has been very well received by distributors as an effective way to communicate equity valuations and help investors make better informed investment decisions. I understand your team has now come up with another very intuitive communication tool that helps distributors in this effort. Can you please take us through this new tool?
Kalpen: Yes, we have been trying to come out with a series of sales conversation ideas which can help position investment opportunities and investment ideas to investors in their language - in a manner they can understand and appreciate. One idea which has been extremely popular and continues to be used on a regular basis by our teams as well as our distribution friends is our traffic signal idea, which highlights the zone of valuations. It conveys a simple investment belief and truth, that if you buy equities in the cheap zone, your margin of safety is high and that leads to better returns. On the other hand if you buy equities in expensive markets your near term returns tend to be very poor and you have to really wait for a longer period of time to even get your average returns. And it also establishes a very simple fact that Indian markets have been rewarding to investors over the last 10, 15, 20 years, provided this basic discipline is kept in mind. We have data since 1996 that we have used in this PE based traffic signal chart which says that over the last 17 years, Indian markets have delivered around 16% CAGR. Good quality Indian equity fund schemes would have delivered 2 to 3% more than that because of the alpha. But the average return of the investor would be sub-10%. And this difference between the market return and the investor return is the price of the discipline and is the price of the right or wrong entry.
The tool also shows that 70% of the flows in the last 16 years in our industry have typically come in the red zone, and only 30% of our flows have come in the green and the yellow zones - which are basically cheap and the fair value zones, where investments for a period of 3 to 5 years and above have been reasonably rewarded.
We have now extended this further, with another new tool, which as you rightly said is extremely intuitive. We Indians love our newspapers we can't start our day without reading a newspaper and large part of our day goes about talking about what newspapers talk. Newspaper headlines also have a big influence on our behavior - especially when it comes to investment decisions. So we thought of going back into the history of last 13 years and see how headlines influence our behavior.
The simple message that this new sales idea tries to highlight is that returns are a function of right price and right valuation and not necessarily headlines - although it is headlines and not valuations that often drive investment decisions.
We have seen that good headlines in the newspapers, which tend to make investors optimistic about investments, have tended to give average to below average returns and bad headlines extrapolated then into the future have given reasonably good returns. So whenever present headlines look very attractive or very encouraging lot of that is already captured in the prices in the markets and which is why markets tend to be valued richer and future returns are therefore muted. This was the basic premise that we tried to establish and test. It took us 6 months to build this because we had to get actual data for the last 13 years and we wanted to show the snapshot of how the newspaper headlines looked on those days. We have taken few milestone months in which our markets have hit certain cyclical highs or lows. After measuring the market levels we have seen what were the valuations in that month. We have also checked what was the overall market sentiments and the mood of the investors. We have mapped the net equity flows in that cycle around that event, whether the flows are positive or negative. And then we have analysed the returns from any investment done at that point in time till date in terms of CAGR returns from the sensex.
The whole package starts by asking a question : are you looking for opportunities in newspaper headlines - and then it takes you to different eras.
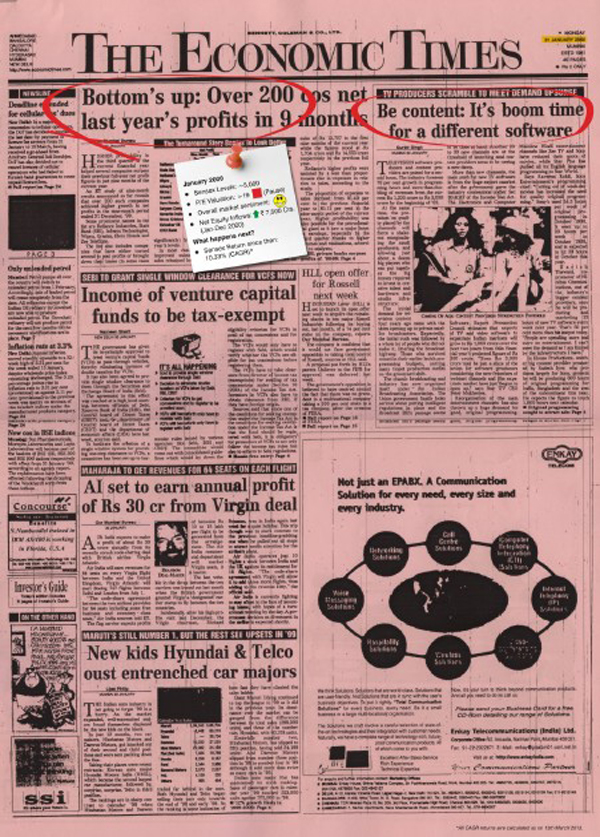
Headlines in January 2000

We start with Jan 2000 - that was the first time Indian markets crossed levels of 5000. Headlines talk about surging corporate profits, about a boom time in software etc. If you notice the little note we pinned up against these headlines, you will see that at that point of time, market valuations were in excess of 19 times, which is the red zone. The overall market sentiment at that point of time was extremely bullish, and that's reflected in the fact that in that entire calendar year January to December 2000 the net equity inflows were 7500 crores. Remember this was not today this was 13 years back - and those inflows represented over 20% of the industry AuM at that time. An investment since then till date, has returned 10.3% CAGR.
Now incidentally this market high was achieved because of exuberance mainly in the TMT or the IT sector. IT was leading the entire pack and that took the sensex values up - and IT was also making headlines, as we can see. While an investment in the Sensex at that time would have yielded a CAGR of 10.3% to date, an investment made in the IT sector index would have yielded only 4.8% CAGR till date.
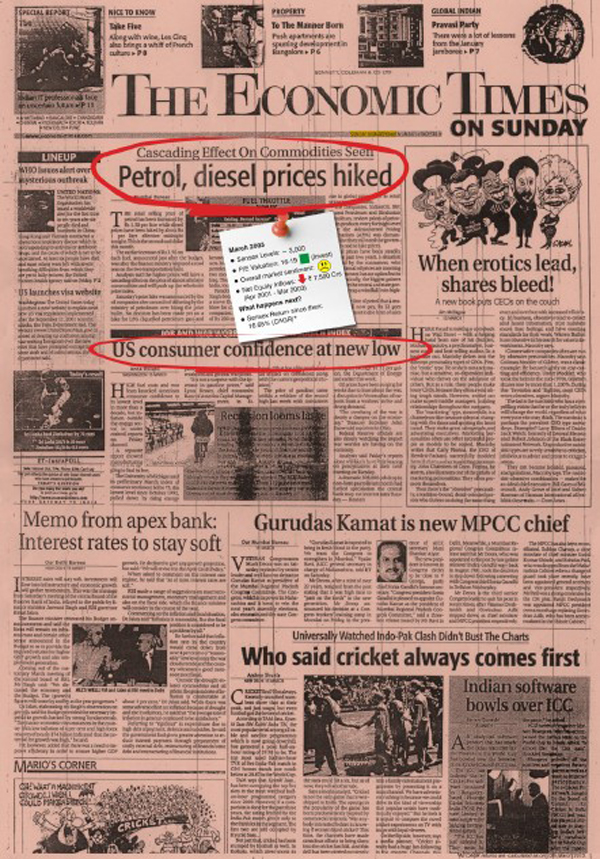
Headlines in March 2003

Lets move to the next headlines which were in March 2003 - the exuberance had been converted into pessimism after 3 years, the sensex was half its peak level at 3000 levels and going by valuations it was less than 16 times - which our traffic signal tool gives a green colour. Investor sentiment was extremely negative reflected by the fact that between April 2001 to March 2003 which is the preceding two year period net equity flows were negative 7500 crores. So all that was accumulated in 2000 was given up in the next two years and headlines were negative like US consumer confidence at a new low, recession looms large, petrol diesel prices hiked and cascading effect of commodity seen etc. Almost 60% of the front page had these negative headlines. These headlines do influence investment behavior, as we know well. And yet, investment done then would have yielded in the following ten year period over 16.6% CAGR - which is very healthy indeed.
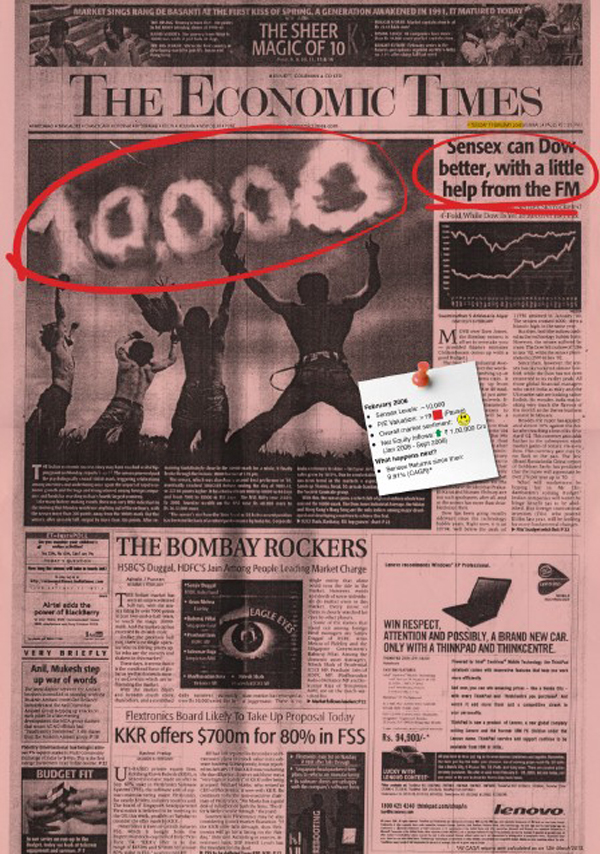
Headlines in February 2006

I move to the next headline which was the first time sensex hit 10000 - the sheer magic of that number ! You have a big screen with people jumping and 10000 in the sky, a new generation awakens and stuff like that on headlines, a suggestion that sensex can do better than the Dow with a little help from FM, the Bombay rockers : all headlines which are positive and bullish, which obviously build optimism about investing. Sentiment was very bullish and positive, so in this period the net equity flows were one lakh crores - almost a new MF industry got created! But, if you looked at valuations on the date of those headlines, valuations were in excess of 20 times - which means a red zone. And returns since then till date which is the last 7 years have been 9.6% CAGR.
In the sales tool, we have given many more such headline illustrations - including 2008 and then 2009 and so on. They illustrate the same point - investments made when headlines are bearish but valuations are in green zone, pay off well, whereas investments made when headlines are bullish but valuations are in red zone, take a long time to turn in reasonable returns.
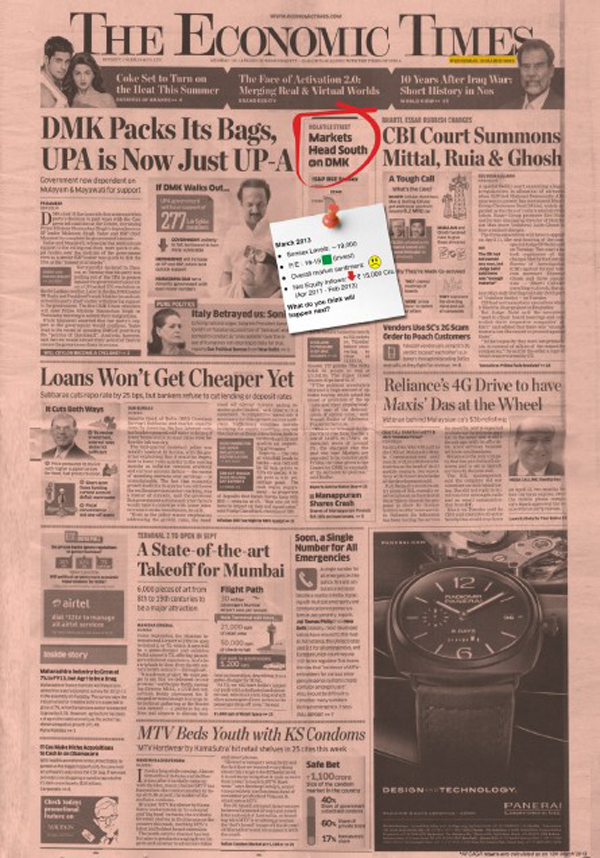
Headlines today

Headlines today are largely negative. Political instability is making headlines, as is a poor macro economic environment. It is easy to get influenced by these headlines and stay away from equities - which is also reflected in the sizeable net outflows we are seeing across equity funds in the industry. Valuations however suggest that we are back in green zone now. If history is any guide, investments made when valuations are green, despite headlines being negative, tend to provide healthy returns over the next 3 to 5 years.
This entire series of headlines finally ends with a quote from a recent article from Warren Buffet:
"I think the worst mistake you can make in stocks is to buy and sell based on current headlines"
Lets create happy investors
The core of what we at IDFC MF have been striving to do since inception of our company, is an effort to try and create happy investors. Whether it is a product launch, whether it is a campaign, whether it is guiding investors in a certain fashion, the key filter or question we ask ourselves is : will investors be happy over a period of time?
Why do we want happy investors? We want happy investors because happy investors are the key to our collective growth. If we have one lakh happy investors they are very likely tell 5 other people to invest in mutual funds and we can then aspire for 5 lakh investors. On the other hand if I have one lakh unhappy investors not only will they not invest but they will tell ten more people not to participate and that earns a bad name for the category.
So the whole approach is to be a more forceful and assertive in times like this when we see market cycles turning, when we see headlines maybe negative maybe a lot of confusion on what is happening in the world around us and what is happening to our economy, to our policies, to various vital statistics like currency, deficit, inflation, growth rates. We have seen historically that whenever there is confusion, markets priced it in their valuation and markets are cheap because we are factoring in all the confusion. If there were no confusion then market would not be where they are. And we also recognize and realize that markets may still continue to be volatile for next few quarters - but these are periods to start becoming neutral to overweight equity. Investors have become very underweight equity in their portfolios in recent years - we have an opportunity in the next couple of quarters to try and correct this imbalance to the extent we can, while markets are in the green valuation zone. Markets don't knock on our doors and announce when they are going to rise or fall. But, investing when they are in green zone, gives us a very good chance of making healthy returns over the next 3 to 5 years.
WF: This is indeed a very useful tool, since many conversations with clients, as you observed, usually start with what's in the headlines today and headlines do influence sentiment. With this tool, distributors will be able to seamlessly take the conversation forward from the headlines to how not to get swayed by them and the perils of doing so - with very useful facts and figures.
Kalpen: Yes, that's right. And to round off the conversation, there is another little tool which we will provide alongside this one to our distribution partners. This is basically a piece of paper which has few statements written on it which when you read it you will not be able to understand it. When you open the page the same text is written on the left hand side and on the right hand side is the mirror and we would ask you to read not the left hand side but the right hand side in the mirror, so see through the mirror and the whole text which was otherwise not possible to read in the mirror will be clear and it says :
"Your advisor can be a provider of market information and can help you maintain objectivity, without getting carried away by greed and fear. Your advisor brings a wealth of experience and client insight, all of which will help you in staying financial healthy."
The idea here is to say that at times it is important to look beyond the noise and the clutter and see the mirror to understand what is really required. Advisors play the role of the mirror - they will help you to analyze and interpret these noises and headlines and take the right investment decisions because they understand your temperament, they understand your needs.
Both these tools - the headlines tool and the mirror need to be blended together in client conversations to encourage customers to look at the things objectively and highlight the role that advisors can play in helping them do this.
WF: Kalpen, hats off to you and your team for continuing to come up with more and more sales tools that can help distributors in their efforts to create happy investors. Your track record of continuing innovation and unflinching commitment to this mission is truly laudable.
Kalpen: Thanks Vijay, I can only say that I am privileged to have a team which is relentless in its pursuit of the outcome that if we can get happy investors, the industry will have sustainable growth, and we all will grow.
These tools will be in our branches from the first week of April. I would urge my distributor friends to use them - do get in touch with our local teams and they can help you with the material you may need for use in your client conversations. Let's all work together to create happy investors !
|