|

Click here to know more about percentiles and the colour codes
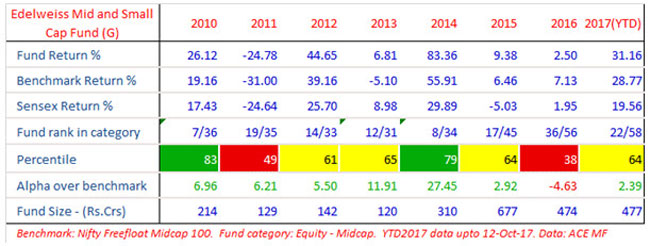
What do percentiles and their colours signify?
Fund performance is typically measured against benchmark (alpha) and against competition.
Performance versus competition is measured through percentile scores - ie, what
percentage of funds in the same category did this fund beat in the particular period?
If a fund's rank in a year was 6/25 it means that it stood 6th among a total of
25 funds in that category, in that period. This means 5 funds did better than this
fund. In percentile terms, it stood at the 80th percentile - which means 20% of
funds did better than this fund, in that particular period. If, in the next year,
its rank was 11/26, it means 10 other funds out of a universe of 26 did better than
this fund - or 38% of funds did better than this one. Its percentile score is therefore
62% - which signifies it beat 62% of competition.
Most fund managers aim to be in the top quartile (75 percentile or higher) while
second quartile is also an acceptable outcome (beating 50 to 75% of competition).
What is generally not acceptable is to be in the 3rd or 4th quartiles (beating less
than 50% of competition). Accordingly, we have given colour codes aligned with how
fund houses see their own percentile scores. Green colour signifies top quartile
(percentile score of 75 and above), yellow or amber signifies second quartile (percentile
scores of 50 to 74) and red signifies 3rd and 4th quartile performance. A simple
visual inspection of colour codes can thus give you an idea of how often this fund
has been in the top half of the table and how often it slips to the bottom half.
A great fund performance is one which has only greens and yellows and no reds -
admittedly a tall ask!
|
Click here to view presentation on Edelweiss Mid and Small Cap Fund
|
WF: Your fund presentation makes an interesting point on myths about midcaps on valuations and quality of businesses in midcap space? Can you throw some light on this?
Harshad: The conventional wisdom in our industry is that mid caps should trade at a discount to large caps, and as a corollary, when the discount narrows, it is time to favor large caps over mid caps. Many treat this as if it is some inviolable law of physics. This misplaced faith in conventional wisdom is contrary to both theory and facts.
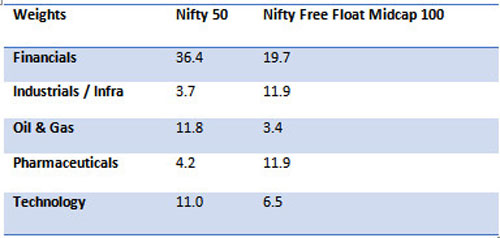
But before we deal with each of these, let us think through the key evidence presented to further this argument, which is valuation of Sensex or Nifty 50 as a proxy for large caps, and Nifty Free Float Midcap 100 index as a proxy for mid caps. The problem with this comparison is that the composition of these indices differs materially.

Data as on 29th Sep 2017
Moreover, the complexions of these indices keep changing. So, the conclusion drawn from this can be meaningless or even misleading.
At the fundamental level, the worth of any business is equal to its discounted future cash flows. So, the value of a business is a function of growth and sustainability of its earnings stream, dividend payouts and the spread of return on equity over cost of equity. This is true for any business, whether it belongs to the large cap or mid cap category.
Another, assumption that many make in this comparison of large cap and mid caps is that mid caps are of inferior quality. We dispute this assumption. We believe there are several high-quality businesses which currently happen to be midcaps because their product/market is currently small. For instance, all the top players in the bearings sector are, at present, mid caps. To equate mid caps as a category with lower quality or higher risk might lead to missed opportunities. The key is to compare a high-quality large cap business with a high-quality mid cap business in the same sector. The discount of mid caps and large caps continues to narrow and has become a premium.
WF: You run a very well diversified portfolio with over 60 stocks and the largest positions being only around 3%. Does this limit alpha generation, especially in the context of many fund managers talking about the merits of high conviction bets to drive alpha?
Harshad: We constantly strive to reflect our level of conviction in the size of the bet we take for individual stocks in the portfolio. However, it is very important to understand that the level of conviction is not a function of just one variable- i.e. expected out-performance. It is important to balance quest for alpha with underlying liquidity in a stock- particularly in mid & small cap segment of the market. In addition, certain sectors tend to be accident prone wherein taking an outsized bet can be risky as negative event might adversely impact overall portfolio performance. In such cases, a basket approach is more appropriate. Therefore, we believe, that for mid & small cap mandates it is prudent to have more diversification.
WF: How does your portfolio stack up in terms of valuations and earnings growth - especially in the context of a market that is viewed as expensive and within that, midcaps being viewed as a potential bubble?
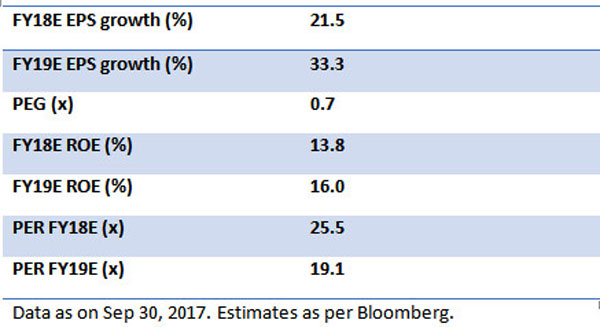
Harshad: The core of our investment research approach is to identify quality compounding businesses. At this stage of the growth cycle, our research effort is also focused on trying to identify cyclical businesses which are well-levered to growth acceleration. As a result, the underlying earnings growth and also the headline valuations of our portfolio are higher than the market but the higher growth more than offsets higher valuations.
It is true that general valuations in the market today are rather demanding. Also, in some pockets- particularly in small cap segment- valuations are at a level which can be termed as a potential bubble. In our view, one way to identify these segments is to check for illiquidity. As elaborated in the earlier answer, our emphasis on liquidity helps us stay away from these pockets.
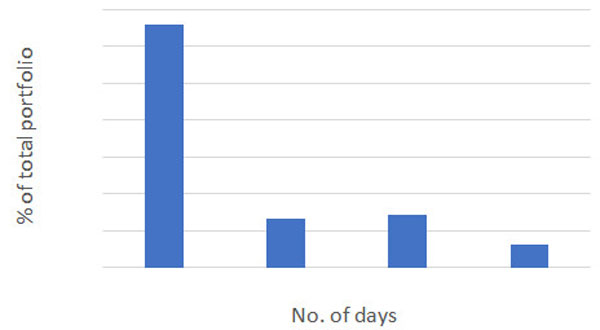
Edelweiss Mid & Small Cap Fund - Portfolio Quality
The portfolio is highly liquid, over 60% of the portfolio can be liquidated in 1 day.

Portfolio with good earnings visibility at reasonable valuations.

WF: Your fund performance in recent years has been very sound - in terms of alpha as well as peer group performance - except CY2016. What went wrong last calendar year and what steps did you take to get back into a healthy performance zone this year?
Harshad: 2016 was indeed a challenging year for our investment performance. As you know, our investment style emphasises growth and quality. However, factors that were rewarded in the market in 2016 were completely at variance to our style. High beta, high dividend yield, low ROE and low EPS growth stocks out-performed. In a nutshell, quality underperformed.
It is important to emphasise that we have not changed our investment process or style just because we had a tough time in 2016. However, one of the key lessons we learnt was to pay as much attention to our negative bets as we do to our positive bets.
WF: Where are the pockets of value in the mid and small caps space and which are the areas you would not want to touch at current valuations?
Harshad: As mentioned before, it is difficult to find quality businesses at apparently undemanding valuations on next 1-2y of earnings. Our focus is on identifying businesses which can deliver strong and sustainable growth in the medium to long term. Also, while analysing cyclical businesses we are focusing on the extent of leverage available and what it could do to profitability during the up-cycle. We try hard to stay away from stocks with weak fundamentals and low liquidity.
WF: What in your view is the investment argument for mid and small cap funds now - especially when there are worries about buying into a potential bubble?
Harshad: We believe it is extremely important to be confident of the underlying quality of businesses in a small and midcap portfolio at this stage. Also, examining underlying liquidity (how quickly can the portfolio be converted into cash) of the portfolio is crucial to guard against any large mismatches between liquidity available to investors and underlying liquidity in the portfolio.

Past performance may or may not be sustained in future and should not be used as a basis for comparison with other investments. Performance as on 30th Sep 2017.
* CAGR Return.
Different plans shall have different expense structure. The performance details provided herein are of Regular Plan of Edelweiss Mid & Small cap Fund. Returns are for Growth Option only. Since Inception returns are calculated on Rs. 10/- invested at inception of the scheme. In case the start/end date is non business day, the NAV of previous day is used for computation. The scheme is currently managed by Mr. Harshad Patwardhan (Managing this fund since 26th Dec 2007). Please refer below link for name of the other schemes currently managed by the Fund Manager.
Fund Performance (factsheet link)
http://www.edelweissmf.com/Download/factsheet.aspx

Disclaimer: Mr. Harshad Patwardhan is CIO - Equity of Edelweiss Asset Management Limited (EAML) and the views express above are his own. The view of the CIO should not be construed as advice. Investor must make their own investment decision based on their specific investment objectives and financial positions and such AMFI qualified advisors as may be necessary.
Mutual Fund investments are subject to market risks, read all scheme related documents carefully.
Share this article
|